Dengue Fever Prediction Analysis
Dengue viruses are spread to people through the bite of an infected Aedesspecies (Ae.aegyptiorAe. albopictus) mosquito. Dengue is common in more than 100 countries around the world. Forty percent of the world’s population, about 3 billion people, live in areas with a risk of dengue. Dengue is often a leading cause of illness in these areas.
I’ll be using data from San Juan, Puerto Rico and Iquitos, Peru to predict the total cases of dengue fever infections for each week. Let’s start out by looking at the total cases of dengue plotted against a time series.
As we can see above, we have 18 years worth of data for San Juan (1990–2007) but only 10 years for Iquitos (2000–2009). To combat this, I split the data into 2 groups (after splitting the training data into a validation set to avoid leakage) based on which city the data belonged to. It’s also hard to see any real correlation on the plot above so I engineered a “month” feature in order to get a better understanding of when infections are most likely to occur. This feature happened to be the most important of any feature in the San Juan data as shown in the plot further down.
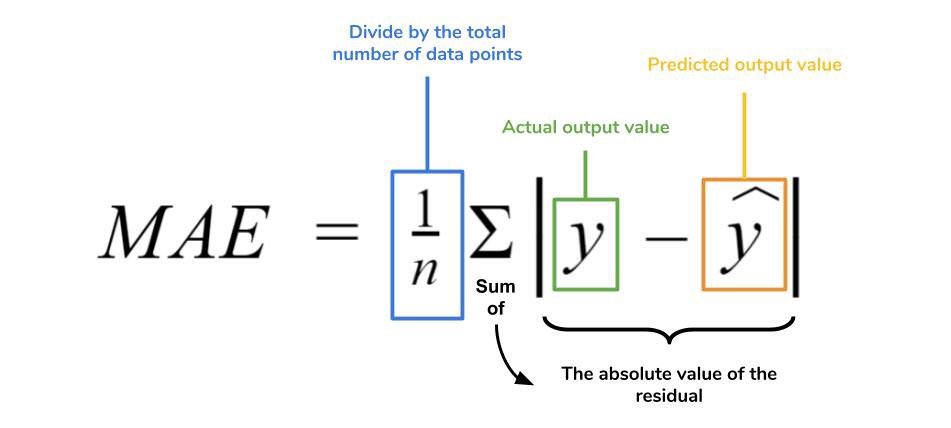
The evaluation metric I’ll be using for my models is mean absolute error.
I’ll be using this as my evaluation metric because it penalizes outlier values less harshly than other metrics like mean squared error (MSE). This is beneficial because we see large spikes in the number of infections in the plot above and we want to be able to anticipate these spikes as well as possible.
This plot gives us a better understanding of our data and shows that infections in San Juan start to rise around July and decline starting in November, while in Iquitos we see infections begin to rise in August and decline in March.
This prompted me to do some research on the seasonality of Puerto Rico and Peru. I found that the climate of Puerto Rico is tropical, hot all year round, with a hot and muggy season from May to October and a relatively cool season from December to March, with November and April as intermediate months.
Peru has two seasons owing to its proximity to the equator. These are not traditionally known as summer and winter, but as the rainy/wet season “summer” which runs from December to March, and the dry season “winter” which runs from May to September.
It’s not surprising that infections spike during Puerto Rico’s “hot/muggy” season and Peru’s “rainy/wet” summer season considering mosquitoes enjoy a warm and wet climate. I used the “months” feature that I created earlier to engineer a “season” feature which turned out to be the 6th most important feature in the Iquitos data.
(See code for correlation maps)
(Feature description at bottom of page)
Before we get started, I’ll calculate the baseline mean absolute error for San Juan and Iquitos by getting the mean value of the total cases of dengue in both cities.
San Juan baseline MAE: 25.60
Iquitos baseline MAE: 7.02
Now that we have a baseline we can jump into predictive modeling. We’ll start out using a ridge regression model, ordinal encoder, and simple imputer with strategy set to most frequent. (You can view the model here.)
San Juan Ridge Regression MAE: 29.98
Iquitos Ridge Regression MAE: 5.63
We’ve achieved a lower MAE than our baseline for Iquitos but I we still need to build a model that can beat the baseline MAE in San Juan. To do this, we’ll use a random forest regressor.
San Juan Random Forest MAE: 17.97
Iquitos Random Forest MAE: 5.82
As we can see, the random forest regressor was much better at predicting the total cases of dengue in San Juan than ridge regression. We can see a 29.8% decrease in MAE for San Juan and a 19.8% decrease in MAE for Iquitos using ridge regression. Here’s how the best models for each city performed against the actual data:
Conclusion:
We were able to separate our data and use different machine learning models to achieve a lower error score than the baseline. There is still much work to be done on predicting dengue. What’s causing these quick, massive spikes in infections? What role does climate change have on the spread of dengue? I think the seasonality of both cities might be more important than the model interprets it. Perhaps some more feature engineering would improve feature importance.
Thanks for reading! If this data set or analysis interests you, feel free to clone this GitHub repository and make sure to share your MAE!
The data for this project comes from multiple sources aimed at supporting the Predict the Next Pandemic Initiative. Dengue surveillance data is provided by the U.S. Centers for Disease Control and prevention, as well as the Department of Defense’s Naval Medical Research Unit 6 and the Armed Forces Health Surveillance Center, in collaboration with the Peruvian government and U.S. universities. Environmental and climate data is provided by the National Oceanic and Atmospheric Administration (NOAA), an agency of the U.S. Department of Commerce. The data is available here.


